
Analytics Dashboard
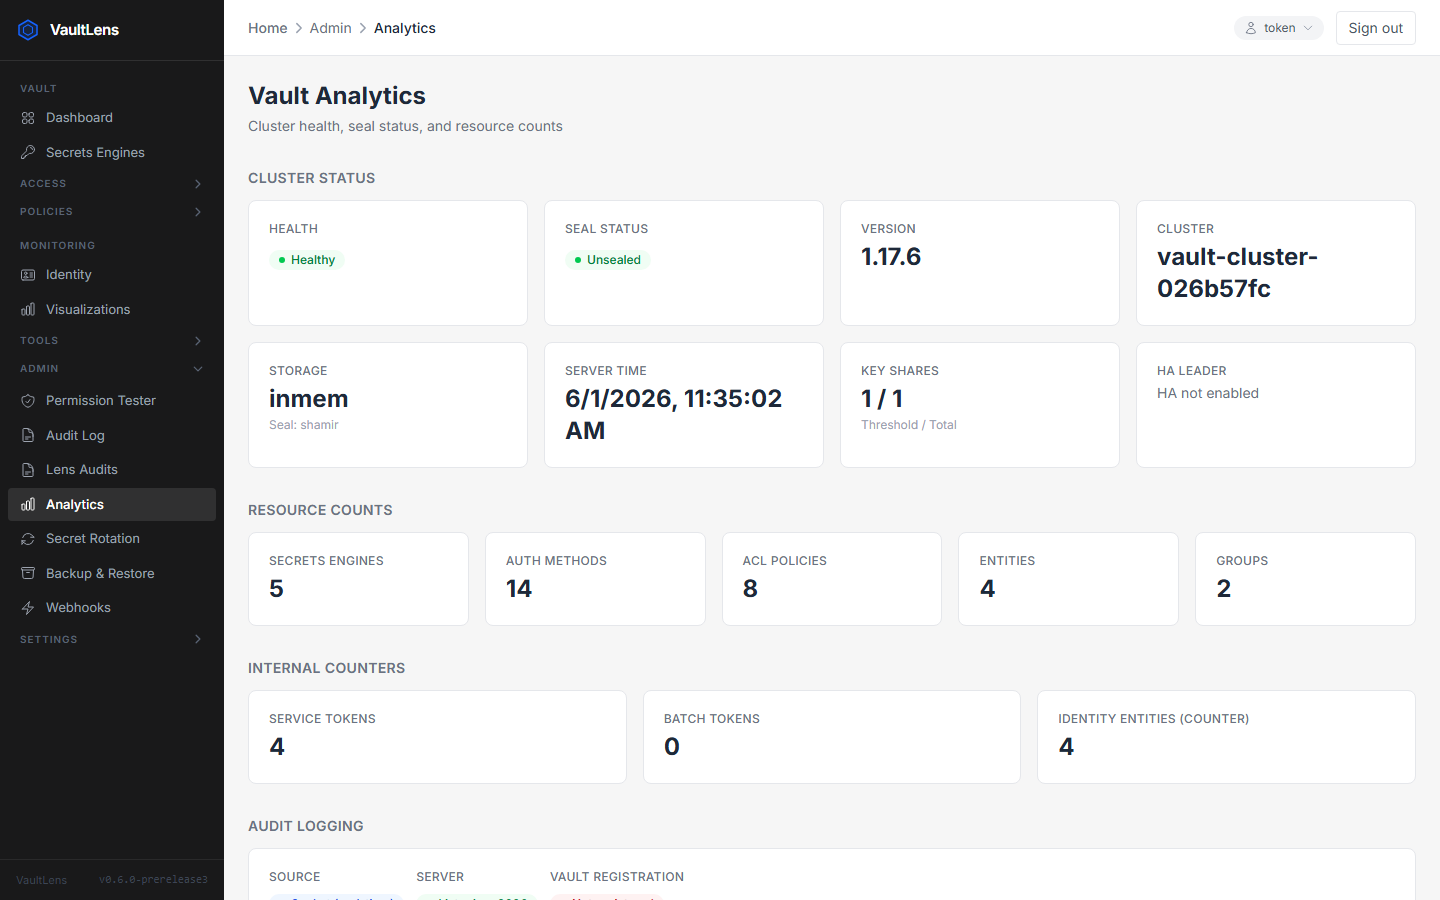
The Analytics dashboard provides a real-time overview of your Vault cluster's health and resource counts.
Accessing Analytics
Navigate to Admin → Analytics.
INFO
The Analytics page requires the vaultlens-admin policy (or root).
Cluster Health
| Metric | Description |
|---|---|
| Status | Initialized / Uninitialized |
| Sealed | Whether Vault is sealed |
| Standby | Whether this node is in standby mode |
| Version | Vault server version |
| Cluster Name | Vault cluster identifier |
| Storage Backend | Active storage backend (raft, consul, etc.) |
Resource Counts
| Counter | Description |
|---|---|
| Secret Engines | Number of mounted KV engines |
| Auth Methods | Number of enabled auth methods |
| ACL Policies | Total policy count |
| Entities | Identity entity count |
| Groups | Identity group count |
Internal Counters
Vault's internal request counters (if enabled) show:
- Total requests
- Requests by auth method
- Requests by namespace
Seal Status Details
Expanded seal information including:
- Seal type (
shamir,awskms,gcpckms, etc.) - Key shares and threshold (Shamir seal)
- Sealed/unsealed state
- Cluster leader address
Auto-Refresh
The analytics page refreshes data every 30 seconds automatically.