
Visualizations
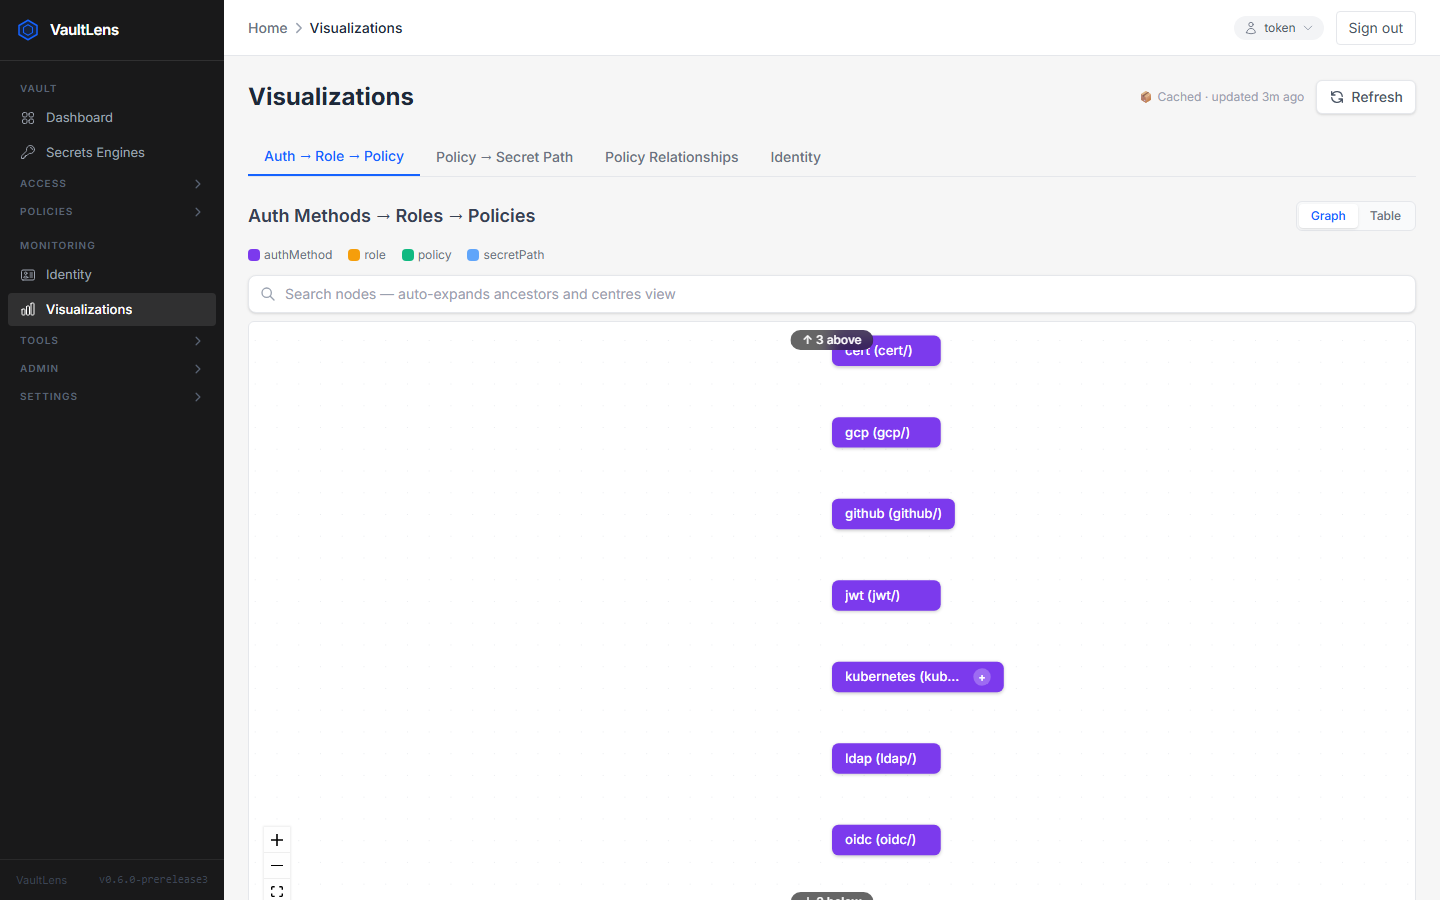
VaultLens provides interactive relationship graphs powered by React Flow. These graphs let you visually explore how your Vault's auth methods, policies, identities, and secret paths relate to each other.
Available Graphs
Auth → Policy Graph
Shows how authentication methods connect to policies through their roles:
Auth Method (blue) → Role (orange) → Policy (green)Useful for understanding which token policies users receive when authenticating through each auth method.
Policy → Secret Path Graph
Shows which secret paths each policy grants access to:
Policy (green) → Secret Path (purple)Useful for auditing what data a given policy can reach.
Identity Graph
Shows the full identity chain across entities, groups, and policies:
Entity (teal) → Group (blue) → Policy (green) → Secret Path (purple)Useful for understanding a user's effective permissions end-to-end.
Interacting with Graphs
- Pan — click and drag the canvas
- Zoom — scroll wheel or pinch
- Select — click a node to highlight its connections
- Fit view — double-click the canvas background to reset the view
Table View
Each graph also has a Table View tab that presents the same data in a tabular format — useful when you need to search or copy specific values.
Node Types
| Node Type | Colour | Represents |
|---|---|---|
authMethod | Blue | Vault auth method mount |
role | Orange | Auth method role |
policy | Green | ACL policy |
secretPath | Purple | Secret path rule from a policy |
entity | Teal | Identity entity |
group | Blue | Identity group |
result | Green/Red | Allow/deny result (Permission Tester) |